

23 May 2018
How Chrome Render Page
Instruction
Recently commit the web performance benchmark framework to the GitHub, here are some background knowledge assistant.
How To Start
Here I use the a profile page as example. Have your latest chrome installed, press F12 to open the chrome development kits.
It looks like this:
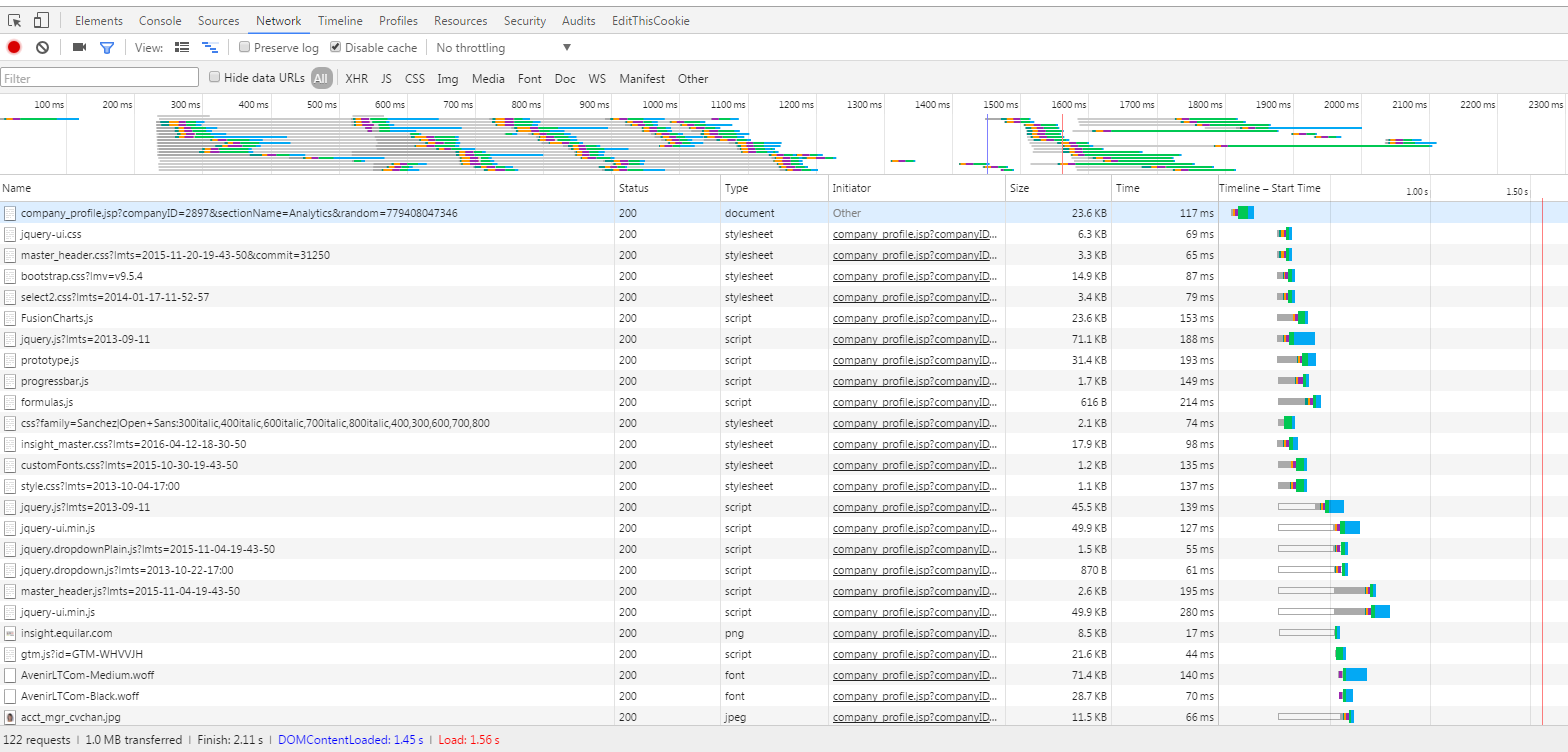
In the next section, will explain in detail about how chrome display this page.
What Exactly Is The Chrome Doing
1.It loaded the target HTML document
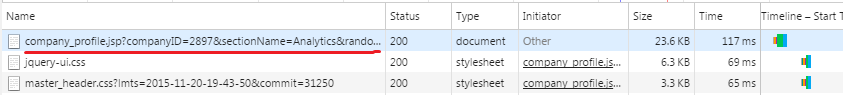
Usually it is the first one of the list, in this case the target page is “company_profiles.jsp”
2.Begin to parse the html document, start to add resource/dependency to download list

this step will spend some time depends on page size and network speed, so that’s why there is a time gap between 1st and 2nd line.
3.Asynchronous downloading the resource
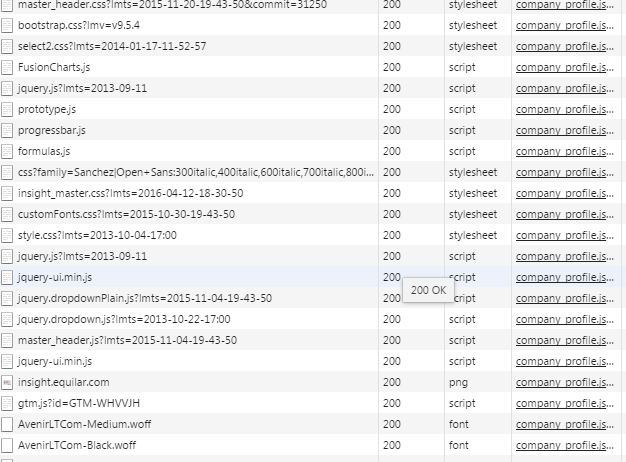
Now the chrome start to download resource required to render the page, continue to parse and generate the Dom tree and CSS Dom tree. The download will happened asynchronous if there is no dependency, the download type will contains script, CSS, image, font. The image is not high priority, it doesn’t effect the Dom tree and CSS Dom tree, so image file will download can happen during the whole page render life cycle.
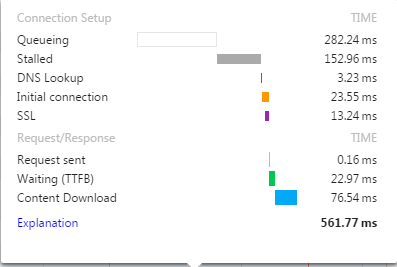
During the download, if multiple resource are downloading, the other resource will be in “Queueing”, if they have dependency, then some resource will be “stalled” by other resource, really “Content Download” time actually not very long.
4.DOMContentLoaded event
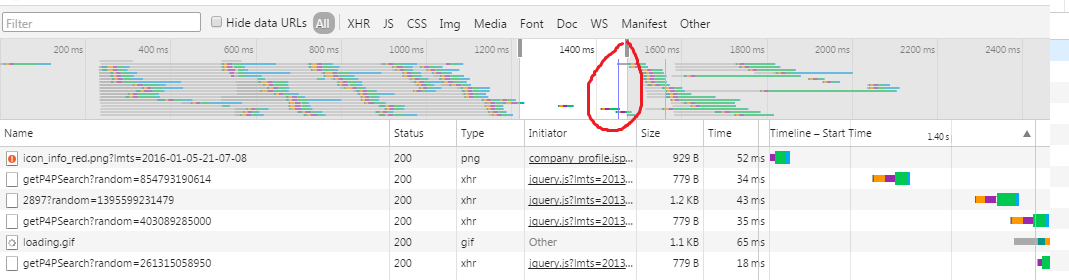
That blue line is DOMContentLoaded event, means current page has been completely loaded and parsed, without waiting for styleSheets, images, and subframes to finish loading. domContentLoaded typically marks when both the DOM and CSSOM are ready (domInteractive means DOM tree is ready).
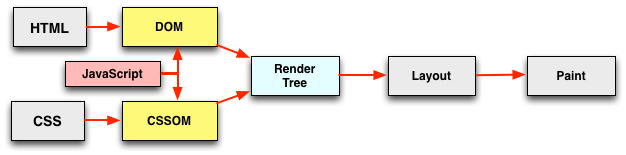
Also, there is time gap in order to parse the Render tree.
5.Onload event
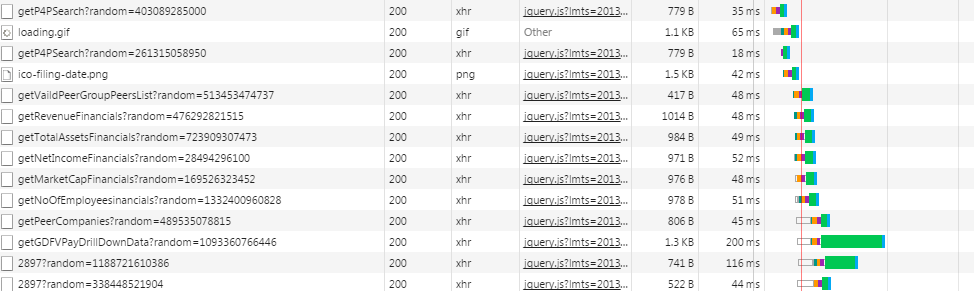
After DOMContentLoaded, the chrome start to handle the xhr asynchronous request(AJAX). That red line is the onload time, means all the images and sub-frames have finished loading, page is not spin anymore.
In Javascript, it is:
DOMContentLoaded==window.onDomReady()
Load==window.onLoad()
6.Finish page render Complete showing all the page, finish all the loading

This Finish is chrome only, it will keep change if new xhr finish, sometime the Finish time is smaller than the load time, this is because the xhr data is in the browser cache.
7.Check from JavaScript API We can get page performance from the JavaScript API
Run in Chrome browser console
> window.performance.timing
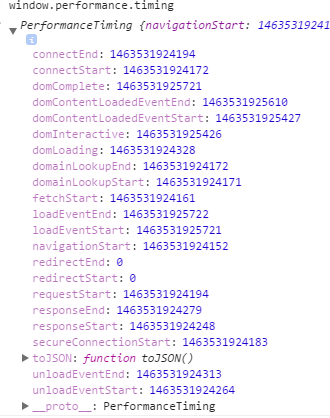
DOMContentLoaded = DomContentLoadedEventEnd - navigationStart Load = loadEventEnd - navigationStart
About window.performance.timing API, can check http://calendar.perfplanet.com/2012/an-introduction-to-the-resource-timing-api/ for more detail
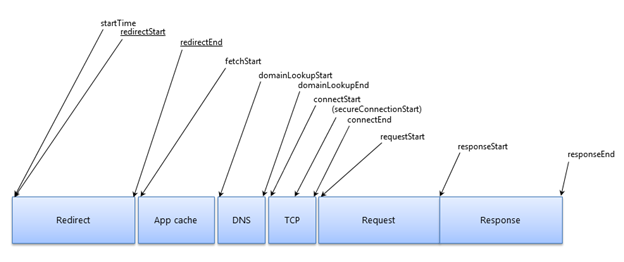
duration: timing.responseEnd - timing.navigationStart
redirectStart: timing.redirectStart === 0 ? 0 : timing.redirectStart - timing.navigationStart
redirectDuration: timing.redirectEnd - timing.redirectStart
dnsStart: timing.domainLookupStart - timing.navigationStart
dnsDuration: timing.domainLookupEnd - timing.domainLookupStart
tcpStart: timing.connectStart - timing.navigationStart
tcpDuration: timing.connectEnd - timing.connectStart
sslDuration: timing.connectEnd - timing. secureConnectionStart
requestStart: timing.requestStart - timing.navigationStart
requestDuration: timing.responseStart - timing.requestStart
responseStart: timing.responseStart - timing.navigationStart
responseDuration: timing.responseEnd - timing.responseStart
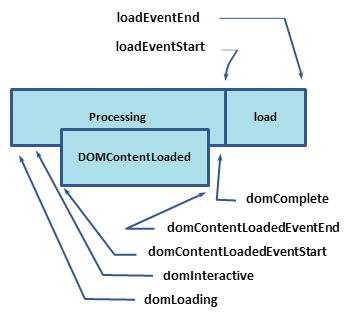
- domLoading: this is the starting timestamp of the entire process, the browser is about to start parsing the first received bytes of the HTML document.
- domInteractive: marks the point when the browser has finished parsing all of the HTML and DOM construction is complete.
- domContentLoaded: marks the point when both the DOM is ready and there are no stylesheets that are blocking JavaScript execution - meaning we can now (potentially) construct the render tree.
- Many JavaScript frameworks wait for this event before they start executing their own logic. For this reason the browser captures the EventStart and EventEnd timestamps to allow us to track how long this execution took.
- domComplete: as the name implies, all of the processing is complete and all of the resources on the page (images, etc.) have finished downloading - i.e. the loading spinner has stopped spinning.
- loadEvent: as a final step in every page load the browser fires an onload event which can trigger additional application logic.
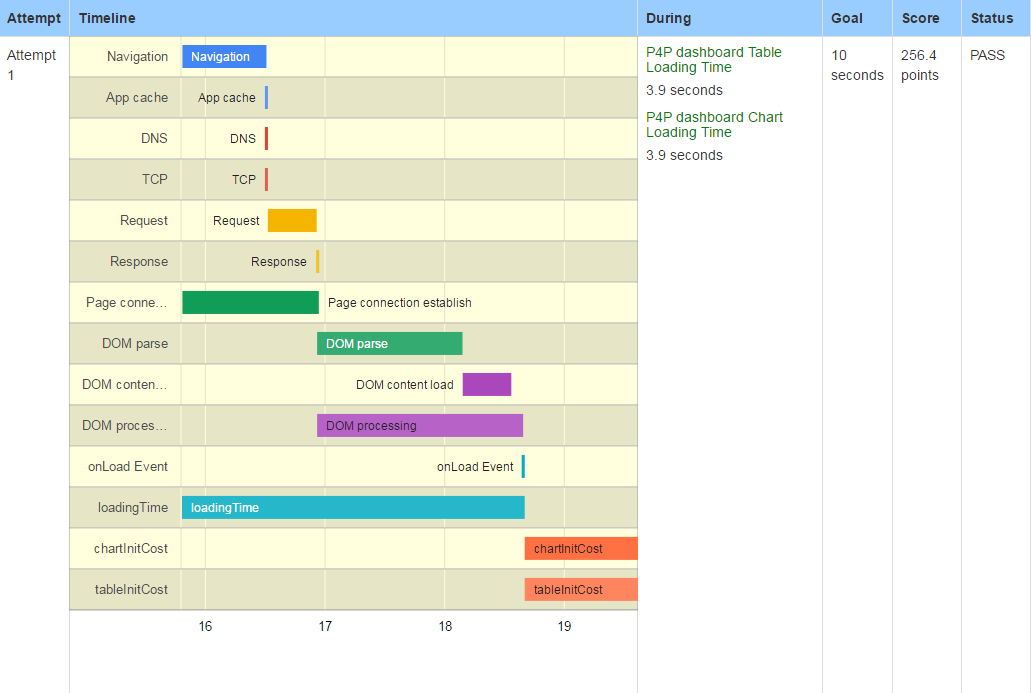
The detail loading timeline has implemented into the Performance-Benchmark
Reference
Analyzing critical rendering path performance
Measuring the critical rendering path with Navigation Timing
Deciphering the Critical Rendering Path
Til next time,
at 00:00
